Testimonials Home Page
Testimonials
“Justin has proven his worth by being more than an investment advisor. He tries to bring value to every interaction and is a name to watch in this industry going forward.” - Fabiana Lara, creator of The Next Big Rush
"Justin Hayek has been my investment advisor for over 7 years. I find his market knowledge invaluable. He has helped my portfolio grow, exceeding my expectations. I will continue to take advantage of his expertise and would highly recommend him to anyone looking for a fantastic advisor!" - Chase Shymkiw, Maple Ridge, BC
Top Performing Mining Stocks in the Last (Great) Bull Market: Will History Repeat?
Back in October 2019, I gave a brief presentation at the Silver & Gold Summit covering the top performing mining stocks of the last (great) bull market for precious metals (September 2008 to September 2011). I thought I would dust off the presentation and have a look through to see what was learned from then and how we might be able to use this information and apply to today.
Performance of the precious metals - Silver & Gold
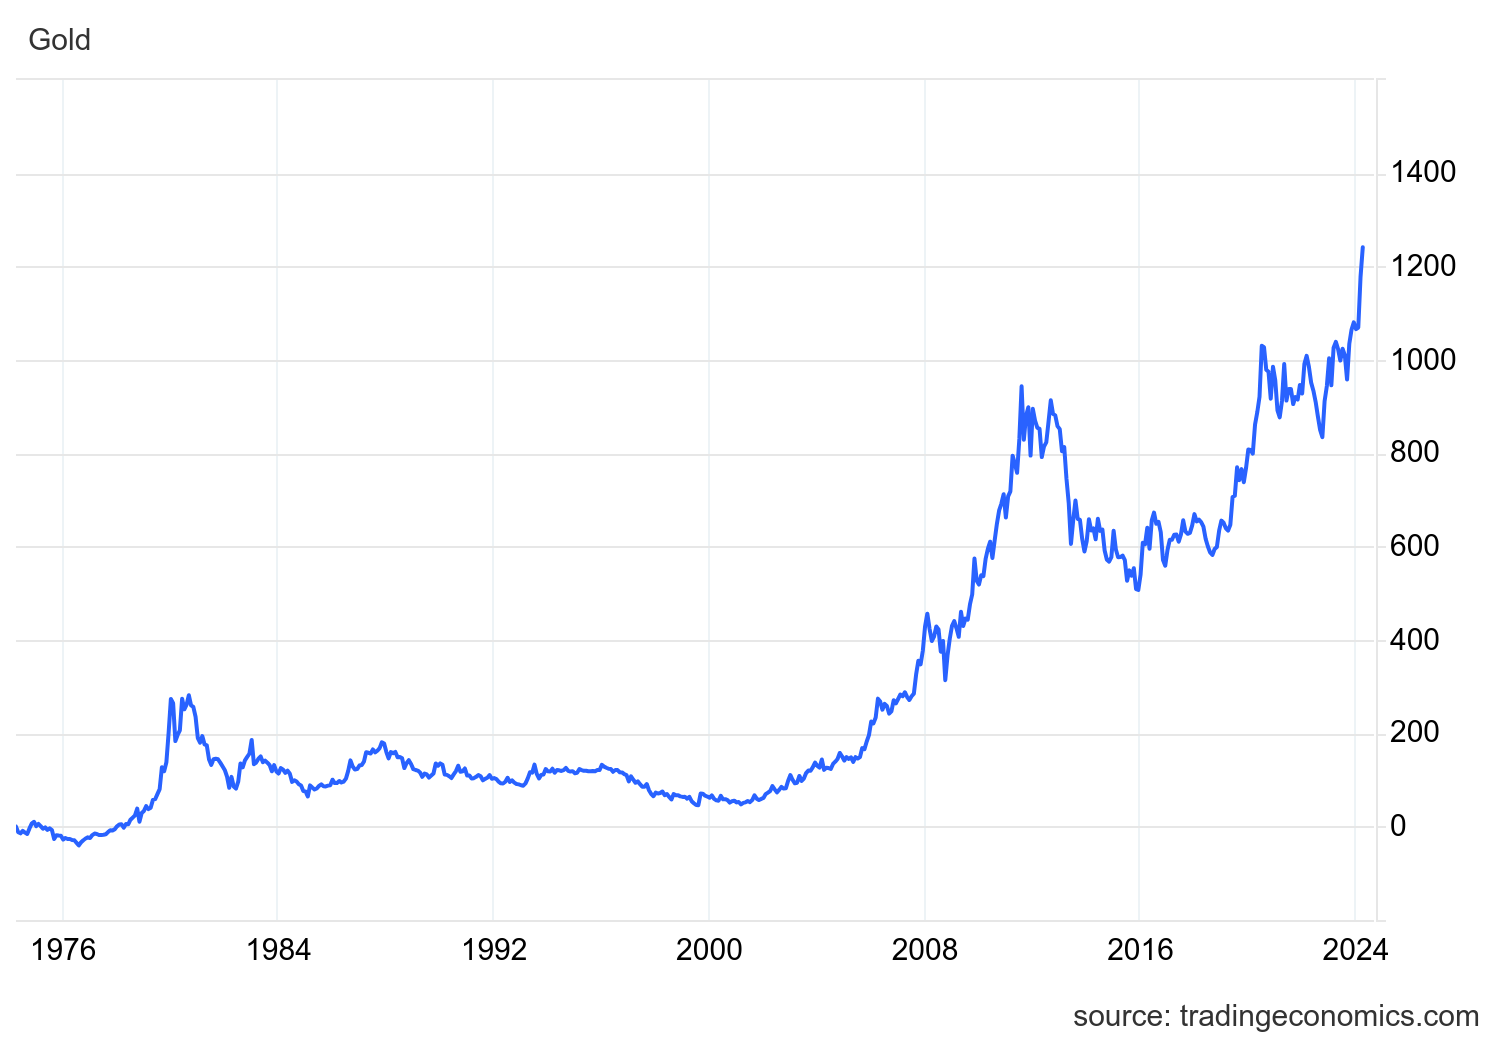
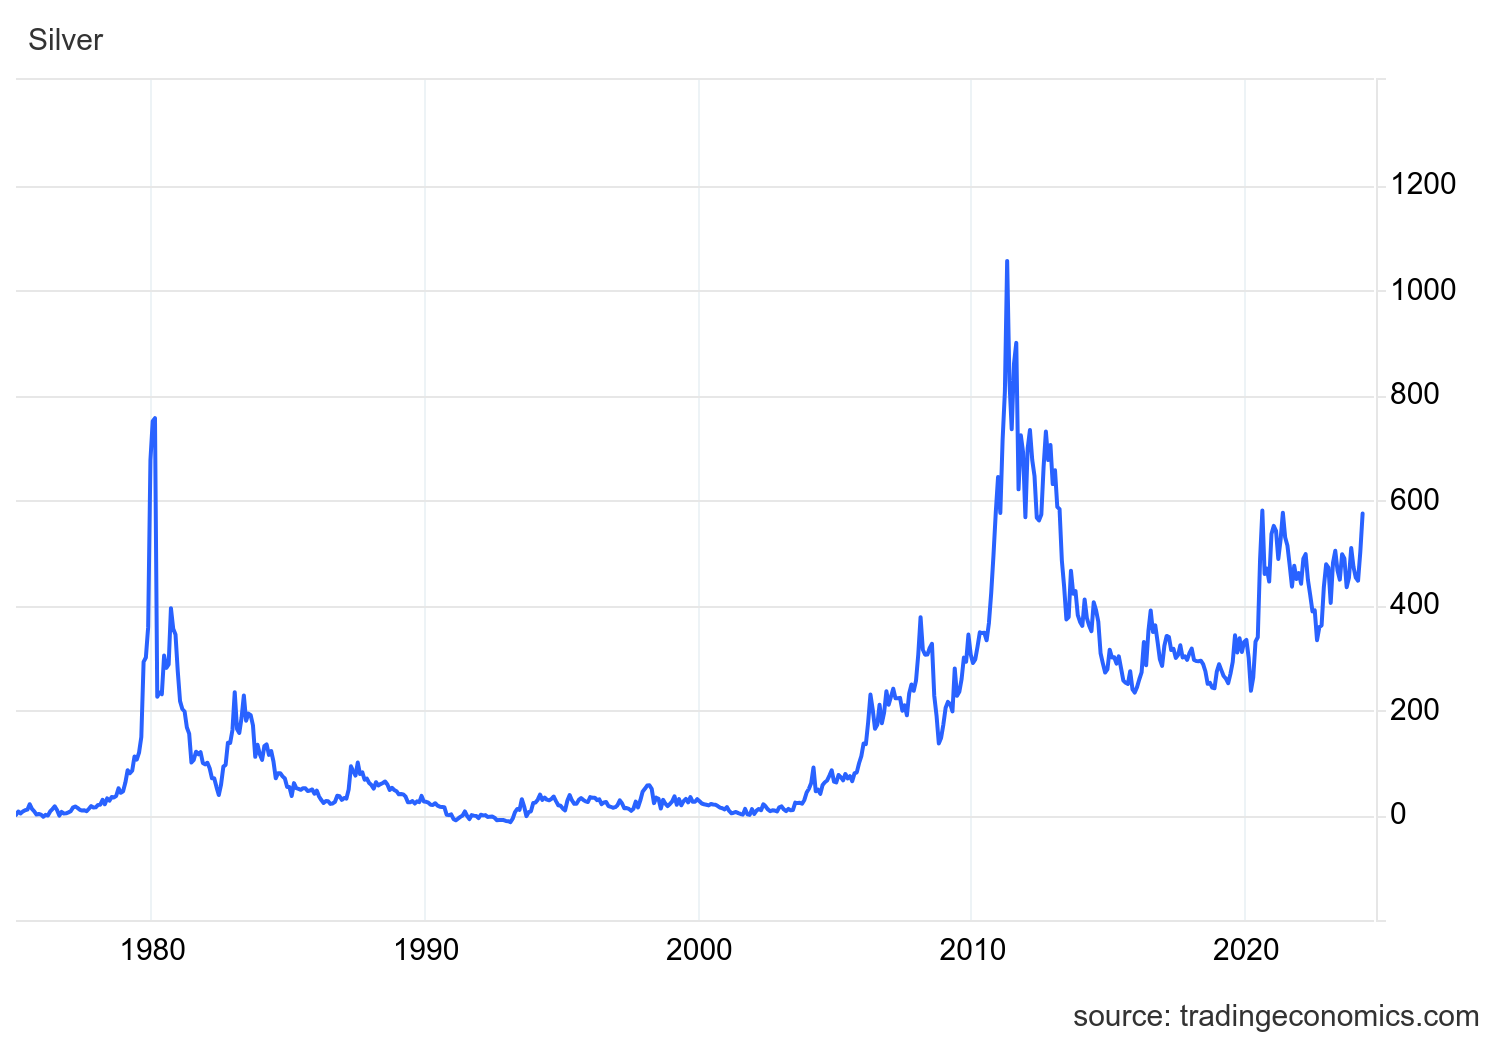
Starting with a high level overview. Between silver & gold, which of the two performed best in previous bull markets?
Historically, silver has outperformed gold through bull markets (from bottom to peak). However this is a double edged sword, as the dramatic price increases are followed by equally dramatic price declines when transitioning from bull to bear markets. Note the below performance charts are measured in % returns.
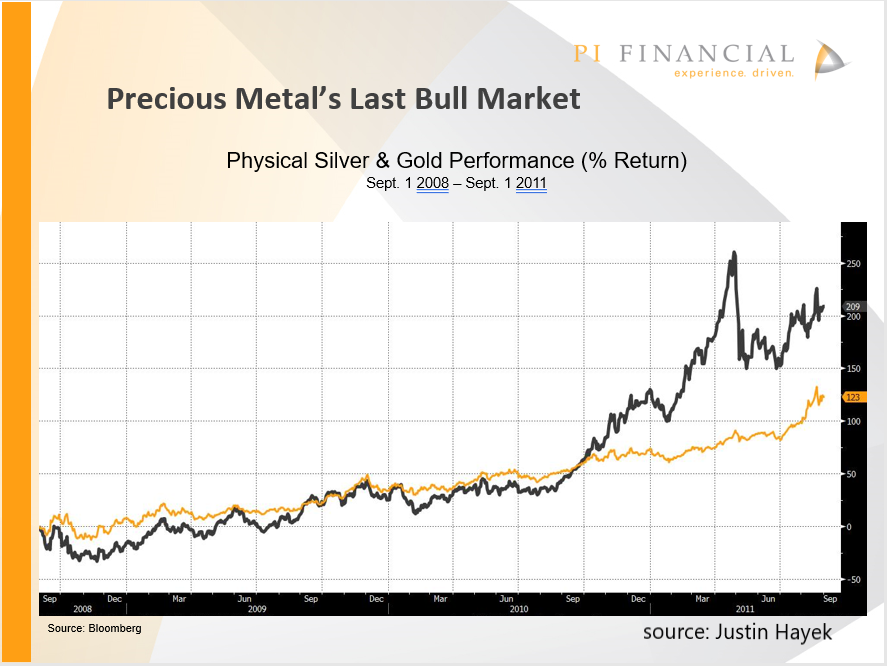
The relative performance between physical silver & gold from September 2008 to September 2011 were no different and are presented below. Silver (grey line) outperformed gold (yellow line) by a wide margin, almost +90% difference over the referenced time frame.
Improvement in Metals Prices Leading to Improvement in Market Capitalization
Chart below depicts the rise in market capitalization for the precious metals sector from 2000-2019. Note the rise from bottom in 2009 to peak in 2011 was approximately +165% in overall sector market capitalization, outperforming the performance of physical gold (appx +123%) but lagging that of physical silver (appx +209%).
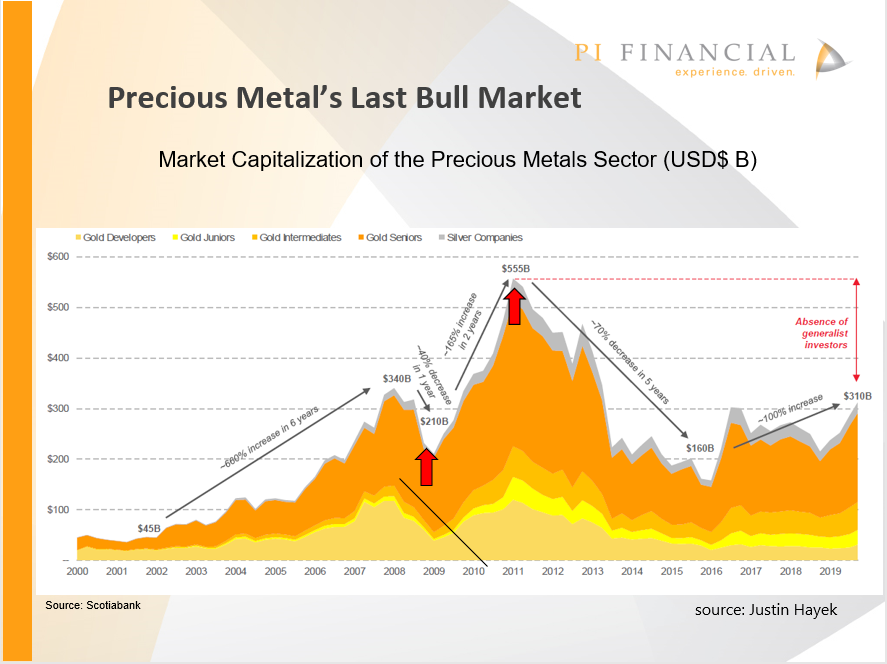
Two observations can be taken from this;
1) Much of the sector's performance can be attributed to its beta (leverage) to precious metals as...
2) Dilution can negatively impact shareholder returns.
Performance of Precious Metals Equities Relative to Precious Metals
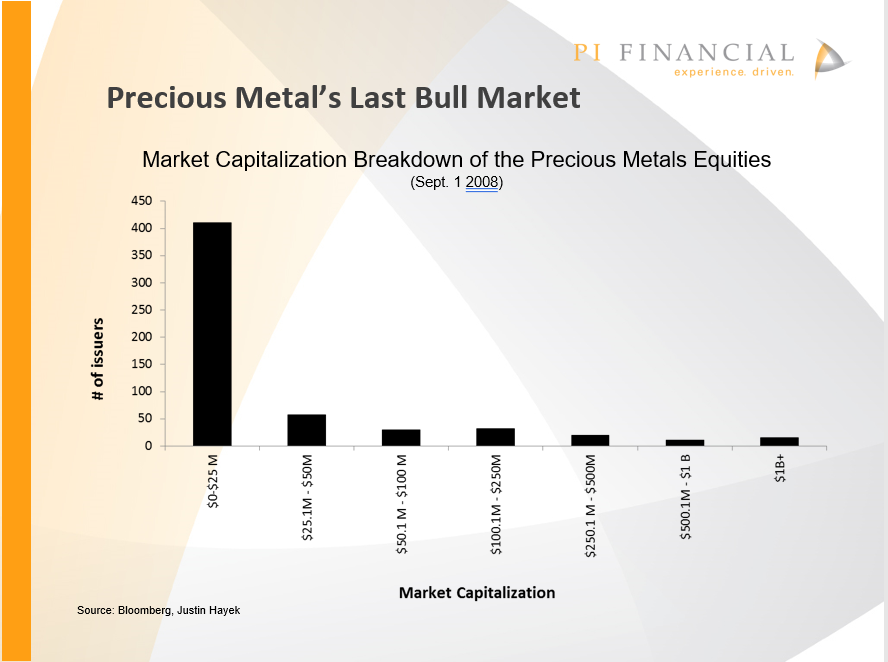
First, it only makes sense to breakdown the precious metal equities into different market cap buckets. This gives us the best look-through at how mining issuers at various stages of project development performed relative to another: from a junior explorer, developer, junior producer to senior producer.
Each market cap bucket had a number of issuers within it in September 2008, with the majority of issuers (appx 400) in the $0 to $25 million market cap category.
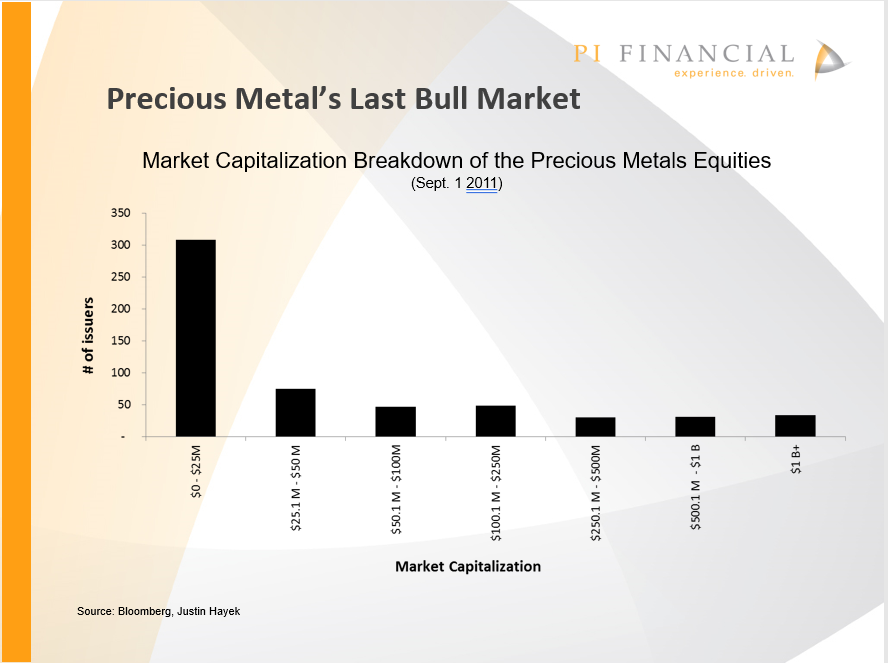
Fast forward to September 2011, after significant improvement in precious metals prices, the number of issuers improving their market capitalization (not necessarily share price) was meaningful.
There were approximately 100 fewer issuers with a market cap between $0 to $25 million, with some of these issuers graduating to the next category or beyond.
We also saw an improvement in issuers moving across and towards greater market capitalization buckets (from $25.1 million through to $1 billion +).
This bodes well for the sector as a whole. But how did investors fair? The best way to measure general equity performance is to look at the performance of two key mining indices; GDX (VanEck Gold Miners ETF) & GDXJ (VanEck Junior Gold Miners ETF). Both of these index ETFs serving as a proxy for the performance of precious metals equities.
Surprisingly, both index ETFs LAGGED the performance of the underlying physical precious metals. Even by a substantial margin.
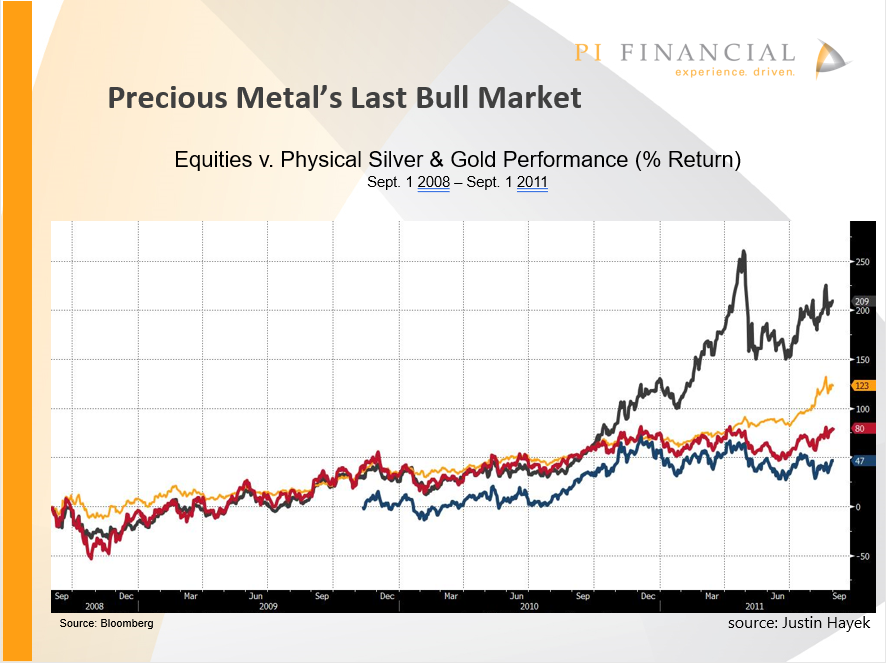
Grey line = physical silver
yellow line = physical gold
red line = GDX
blue line = GDXJ (inception date of Nov 2009)
Drilling down into "why the under performance in equities relative to the physical metals?", I started to look at the performance of the equities within the various market cap buckets. The slide below is a visual of the worst & best performing equities under each market cap bucket indicated by grey bar. Along with the average performance of the equities (yellow dot) based on their initial market cap bucket in September 2008.
The variability is significant.
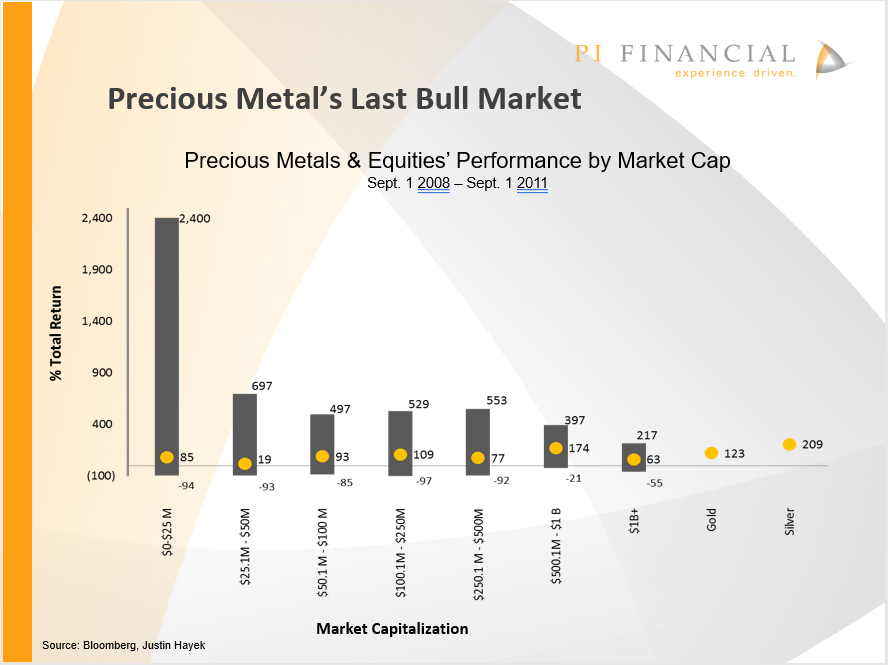
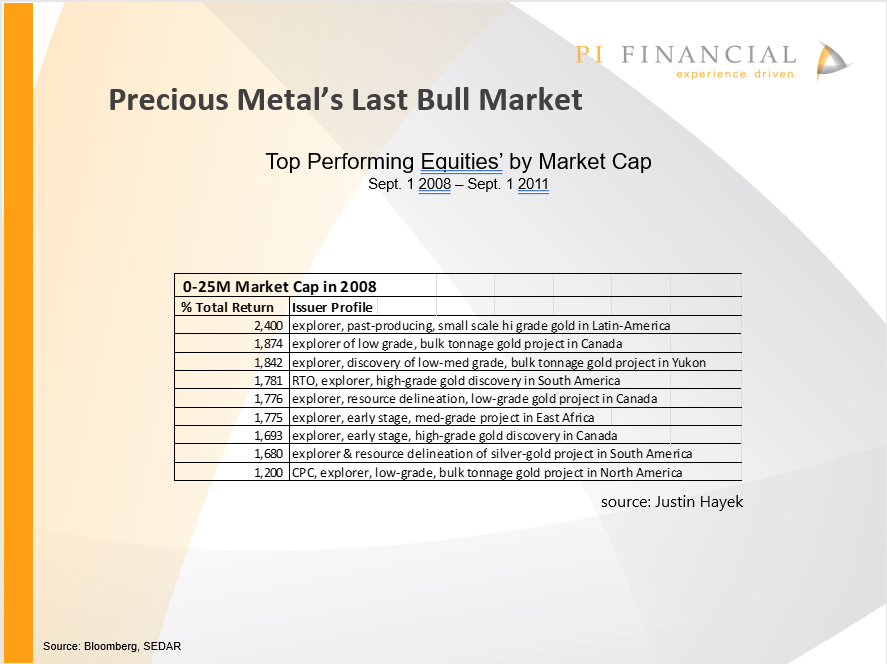
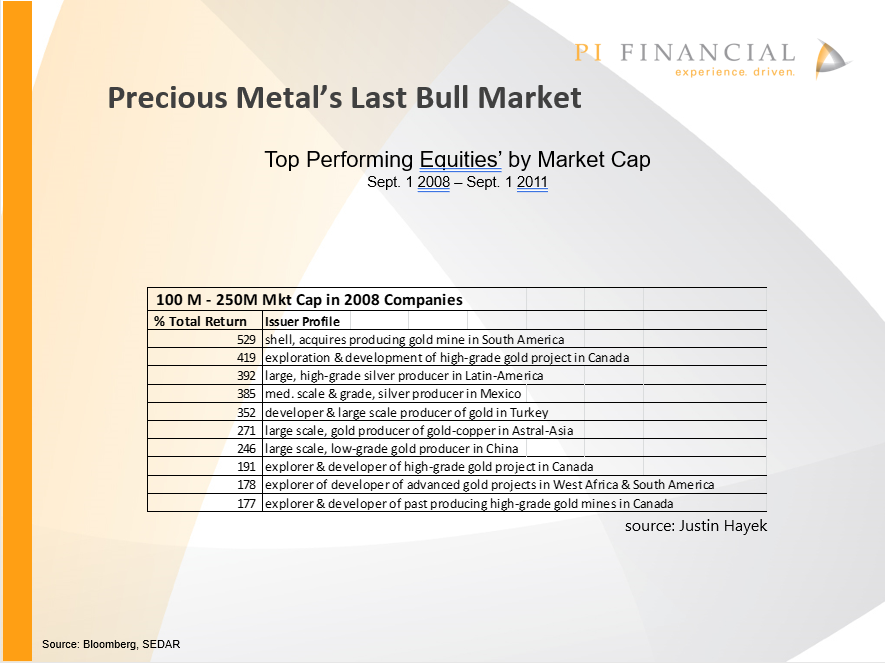
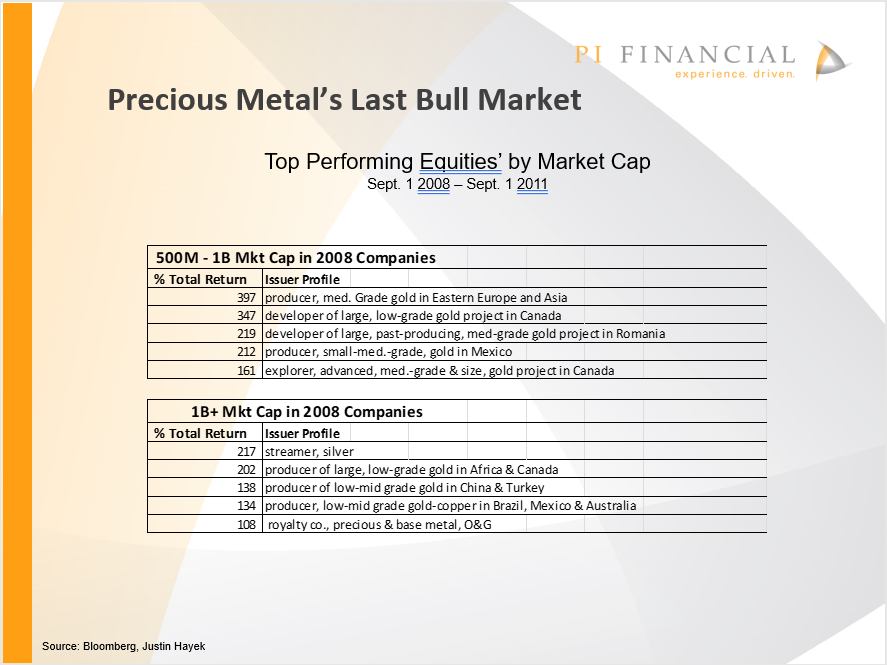
The top performing issuer starting with a market cap of sub $25 million in September 2008 generated a return per share return of +2,400% by September 2011. Contrast this with the top performing issuer starting with a market cap of $1 billion+ in September 2008 generated a share price return of just +217% by September 2011.
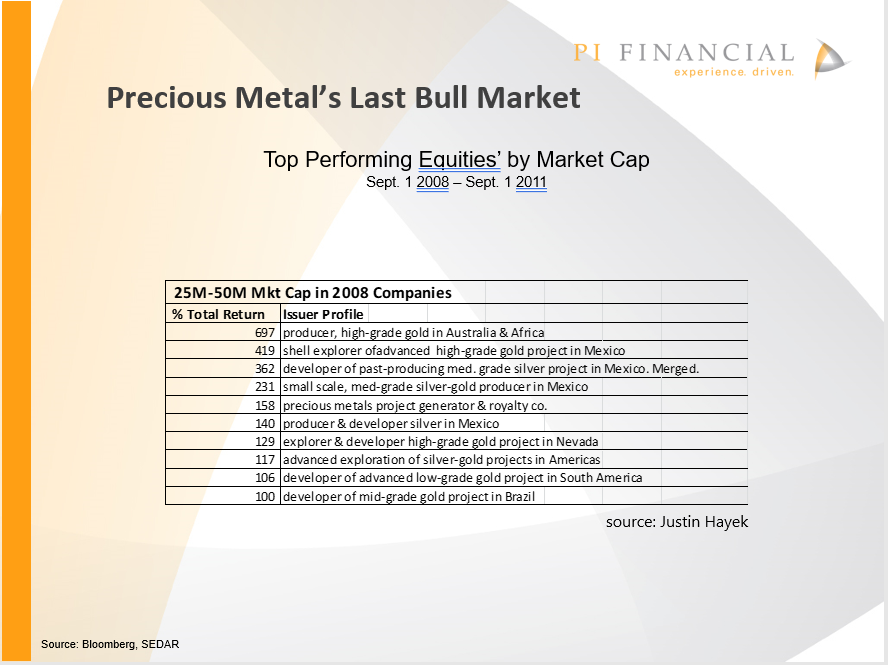
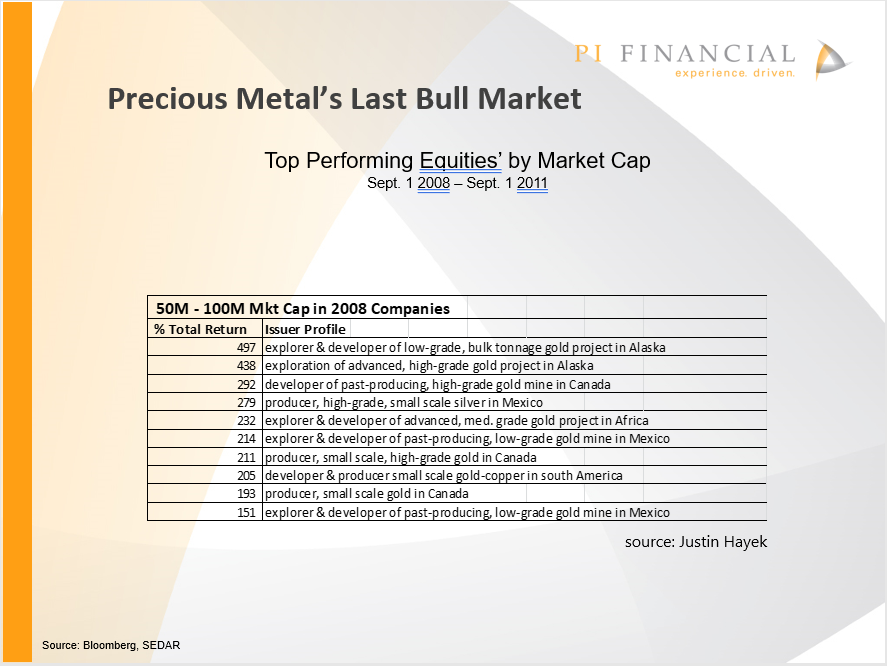
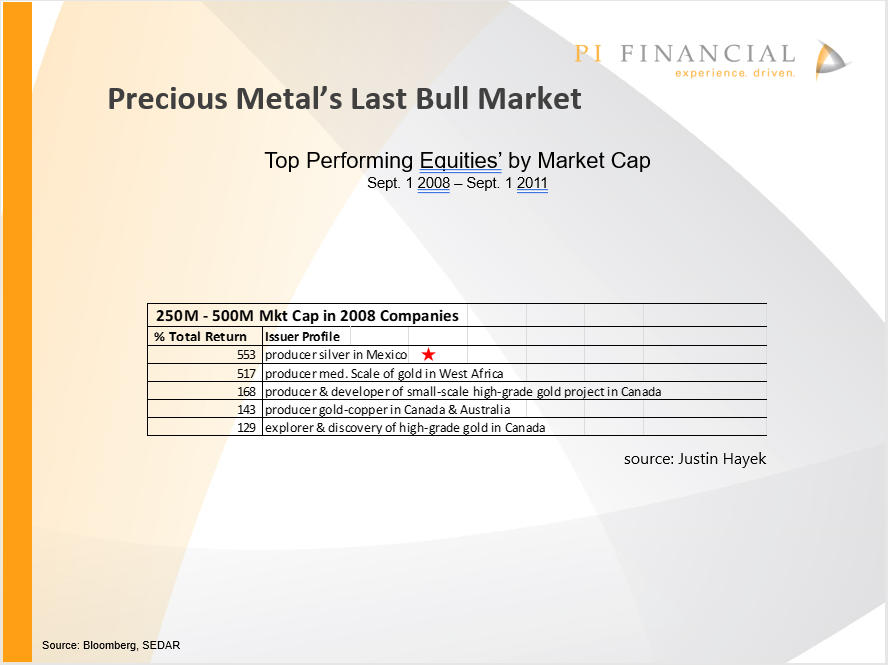
What Kind of Precious Metals Project Generated the Best Return?
The answer may not surprise you. There was no one style of project or geographical location that delivered the best results for issuers and shareholders. The following tables are a description and breakdown of the top performing issuers under each market cap bucket (as they started in September 2008).
Observations & Findings
In looking at the above slides, and pondering about the tendencies of the precious metals sector, we can come to a couple of conclusions;
- Historically physical silver outperforms physical gold through the bull markets, but also declines more from peak through the bear markets.
- Much of the lift in market capitalization within the sector comes from the leverage/beta to commodity price.
- Issuer's market capitalization generally improve but does not necessarily imply improved share price.
- Destructive dilution limits share price appreciation and reduces shareholder value creation.
- No one style of project, or jurisdiction was key to creating shareholder value in the last precious metal bull market.
When considering investing in the precious metals sector, keep the above points in mind. This is a volatile sector, adding single security risk can amplify volatility. Please consult with your investment advisor to discuss the risks or contact me (jhayek@pifinancialcorp.com) before making any investment decisions and to assess suitability.