Testimonials Home Page
Testimonials
“Justin has proven his worth by being more than an investment advisor. He tries to bring value to every interaction and is a name to watch in this industry going forward.” - Fabiana Lara, creator of The Next Big Rush
"Justin Hayek has been my investment advisor for over 7 years. I find his market knowledge invaluable. He has helped my portfolio grow, exceeding my expectations. I will continue to take advantage of his expertise and would highly recommend him to anyone looking for a fantastic advisor!" - Chase Shymkiw, Maple Ridge, BC
The TSX Venture Exchange: A Ghost Town of Trading? Exploring the Enigma of Low Volume
Submitted by Justin Hayek on June 19th, 2023Over the past few weeks, I have had numerous conversations with clients and people within the industry, where the topic of discussion eventually turns to the lack of volume and general malaise of the TSX Venture Exchange. But just how poor are trading volumes (or liquidity as we call it) of late? How does the current low liquidity compare to previous periods? Might liquidity dry up even further?
In this blog post we address these questions as we delve into and explore the enigma of low volume on the TSX Venture Exchange: A Ghost Town of Trading.
Ye Olde TSX Venture Exchange

A logical place to start is by looking at the available data. Luckily for us the TSX Venture Exchange publishes trading and financing statistics on a monthly basis. This gives us the opportunity to look at the venture in aggregate and objectively. Its far too easy to look at positions within our personal portfolios as a sample and extrapolate to the rest of the market which may not be a fair representation.
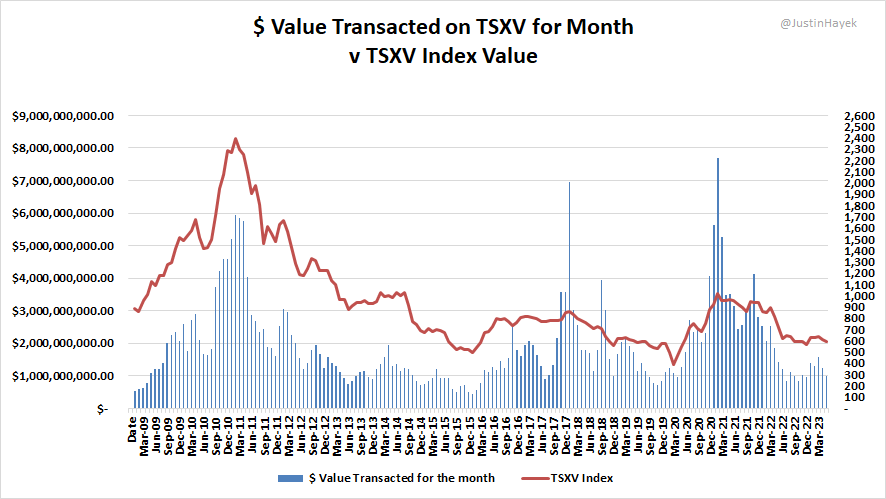
We (thanks to my assistant Chris) have taken the data available from January 2009 to May 2023 and created the below graphic. A couple of immediate observations to be made and highlighted:
1) There appears to be a strong correlation between the TSX Venture Index value and $ value transacted over the month on the exchange.
2) Peaks and troughs in TSX Venture Index values are generally associated with tops & bottoms for $ values transacted

Within the above chart, blue bars represent the total $ value of transactions on the TSX Venture for the month, the red line represents the TSX Venture index value at end of month. Notice how the two tend to move in tandem. In fact, you might be able to mark near term market tops and bottoms simply by looking at the $ volume of transactions. Logically this makes sense as market tops are formed when a marginal buyer or the last bear has succumbed to the allure of the bull market and bought. Or when market euphoria has taken over. Either way how we define it, market tops are when buyers, capital invested and therefore turnover are at their greatest.
Market bottoms are quite the opposite, naturally, of market tops. At these levels, there is a lack of buyers and volumes decline precipitously. Bids (buyers) dry up and selling tends to exaggerate the declines of these typically already illiquid securities. These time periods are also marked by a general lack of interest by retail investors to allocating additional or even moving around risk capital. Sound familiar? We will touch on the more recent months and how they compare to years past. However for now lets just say my phone is not ringing off the hook.
A Broker During a Quiet Market

For reference and context lets compare the present 'quiet' market to previous. This recent decline in volumes and overall liquidity can be marked from June 2022 to now (numbers not yet available for June 2023).

The table above gives more context as to how this quiet period feels compared to previous. Of course looking at the numbers we know then liquidity on the venture exchange has been worse in the past. Much worse. For frame of reference $1 billion of value transacted over an entire month on the TSX Venture is equivalent to approximately 1 hour's worth of trading on Apple's stock. 1 hour of trading!! Suffice to say the TSX Venture is a rather illiquid exchange and therefore collection of securities.
But what about the 'good times'?
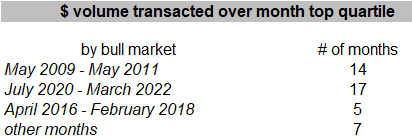
Without getting too picky and technical I am going to quantify a bull market as sustained period of increased $ volume transacted on the TSX Venture Exchange until each subsequent month adds to the average $ volume transacted & a short term trough to peak for the TSX Venture Index value. In essence, we've had two sizable bull markets since 2009 and one weak one as defined below;

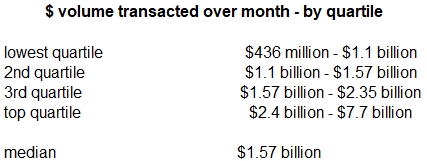
The difference in $ volume transacted between 'bull' and 'bear' markets is notable. Roughly 2 to 4 times more liquidity and turnover during a bull market v bear market. Though the most interesting data points are when we start to look at the highest $ volume transacted during these two different markets. Breaking the volumes down by quartile we get;

Further breaking down the data by quartile, we get an interesting result:

All in all, 36 months out of 43 observed months (83%) for highest monthly $ volume transacted were during a bull market. There are exceptions however with some 'other months' being part of top quartile but not part of a bull market (17%). To sum, if the market is active it is likley a bull market.
What does this all mean for the TSX Venture?
To me this data and observations points to a couple of conclusions;
1) the TSX Venture is largely driven by volume and flow of capital. Capital has the ability to flow into the market quicker than new public companies can be created and so its a matter of flow (demand) vs. stock (supply)
2) the best time to be a seller is when volumes & liquidity is generous. The best time to be a buyer is when no one cares about the market. Both of course are easier said than done.
What happens going forward?
Even if history serves as a reliable indicator, though is not a guarantee of future results, no one really knows. There is a real possibility liquidity does not improve over the summer (it's summer doldrums as we like to call it) in fact may worsen July & August. Historically we do see a pick up in activity come the fall and before Christmas holidays. However we could also see a sustain lulled in activity for some time barring two variables 1) a meaningful improvement in commodity prices (plausible) or 2) meaningful improvement of investor sentiment & return of risk capital (im not so sure).
Either way we know we have seen this type of market in the past and seen the pendulum swing the other way eventually. But for now, this is the market which we are invested in.

